Base Metal Commodity Charts
Prices on historical commodity charts can help your trading
Commodity charts give you an indication of the direction of commodity pricing. Due to the nature of the commodity business, the major cycles can be quite long. This is a result of the time bring a new mine into production.
The time can broken down into these basic steps. First, it takes quite a while to search and find a mineral deposit. Once found, typically hundreds of drill results are needed to define the resource then, all of the regulatory hurdles need to be dealt with and the producing facility needs to be built and tested.
In many cases bringing a new mine on stream can take between 12 to over 20 years. In some cases, the mineral reserves are know to exist yet getting them out of the ground and to market is not economically viable.

Bulls and bears are used to describe the up and down of the market. A bull tends to use its horns to lift oncoming threats out of
the way and raises them into the air which is the direction of a bull market. Bears
tend to come down on you from above hence they represent a bearish market or
one that is falling.
The above desk figurines depict the back and forth of the market as it unpredictably tends to move in a preferred direction. They make good gifts for traders, stock brokers or financial advisors.
When base metal prices are low, few companies can raise money to explore for minerals. Under these conditions, many of the existing mines shut down because it costs more to produce the base metal than it can be sold for. As the supply of material slowly decreases, the base metal price starts to increase. Commodity charts are an ideal way to spot a change in the trend of a number of commodities.
There a number of commodities which are used in our daily lives. Copper is used in water piping, and electrical wires. As the number of electric vehicles increases, the demand for copper should increase.
Aluminum is used in transportation due to it being reasonably strong and light, iron ore is used to manufacture steel which goes into large construction projects and cars while nickel is used in batteries and stainless steel which is used in a lot of manufacturing industries.
There is always a need for commodities and as such the supply and demand is continuously shifting.
The table below contains both base metal and precious metal commodity prices.
Commodity Charts
A one year chart of copper price is shown below. From the one year chart you can identify the ups and downs of the copper price. When you think about how to read commodity charts, they can be read just like a standard stock chart.
The charts below are line charts instead of the standard OHLC charts or candlestick charts seen in many stock charts.
To get a close up of the price of copper, the chart below is a one month chart. This chart gives you the last month seen in the above, 1-year chart. To see free commodity charts of other metals just click on the image and you will be taken to Dailymetalprice.com.
A 1.5 year of chart of the continuous contract for copper is shown below from StockCharts. Technical indicators can be added to this quite easily. Both overlays like moving averages (shown is the 20 period EMA) can be added to the chart or underneath the chart other indicators, shown is the Stochastic indicator (14, 3, 3), can be added.
To trade copper you could also look at CPER or ICOP however the volume on these two products is quite low so slippage would likely be an issue.
Chart courtesy of StockCharts.com

By reviewing these charts on a daily, monthly or quarterly basis you should be better prepared to trade stocks that are related to these metals.
In some cases, the price of a metal miner will move more than the commodity itself as the miners are leveraged to the metal. A miner will have a fix cost to produce the metal, say $3.00. Below this price they are losing money and at a price above $3.00 they are making money. So when the price of the metal increases by a dollar over their production cost, they can start to make a lot of money.
In the case of Capstone Copper, shown below, while the price of copper increased from approximately $3.60 to $5.15 (~1.46x) Capstone increased from a low of around $4.50 to $11.00 (2.4x). This is why it can be better to trade the stock instead of the metal. Although there are more variables that go into a companies earnings than just the metal price.

Commodity charts with technical indicators can be easily seen on the TradingView website. The link here will take you to a copper chart where you can add the technical indicators you choose provided TradingView has them. Basic charts can be viewed for free, however the number of technical indicators will be limited.
Using the information in commodity charts to trade base metal mining stocks should give you added confidence in your investing decisions. The price of a commodity will affect the fundamentals of the company buying or selling that commodity. If there is a change in these fundamentals there is a reasonable chance that the stock price of that company will be affected.
Also, remember that one of the main uses for copper is electrical wire and when the economy is improving the need for copper increases as the economy is highly dependent on electricity. You can use the price of copper to gauge the health of the economy.
Two other commodity classes which we have charts for are precious metals and energy related materials.
Gifts for Stock Traders - Stock traders are a different breed. For the stock trader in your life or as a present to yourself consider getting a trading mug. This can be used throughout the day to sip on your favourite beverage and remind you that you are a trader.

I am so proud that my first book is out. Featured in the Sept. 20, 2020 issue of Technical Analysis of Stocks & Commodities on page 62.
Dating the Stock Market
10 Key Mindsets
You Need to Excel as a Trader


Short Course
Introduction on How to Trade Stocks for Beginning Traders
New to trading, not sure where to start. I have put together a short course consisting of 18 lessons. Each lesson should take less than 5 minutes to review. Each lesson provides you with alternate resources to continue learning about that particular topic.
To learn more about this course and sign up please visit the course webpage by clicking the link below.
Essential Tips For This free weekly stock trading course, is designed for beginning stock traders. Save hours of time by getting on the right path before risking your hard earned money. As an added bonus, when you sign up today, to receive this weekly email course, you will receive my short ebook  (a $20 value) |
Required Field*
Unsubscribe anytime
Your information is safe with us. View our Privacy Policy and Terms of Use
Monte Carlo Simulator
for Traders
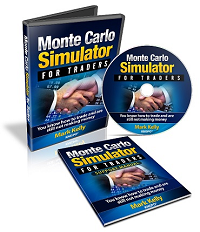 Having troubles sticking with your trading system?
Do you move from system to system looking for the one system that will bring you riches?
Perhaps you already have it and tossed it aside when it went into a down period.
Using this Excel based program will show you what you can expect out of your trading system once you know the % wins and profit factor.
Stop wasting your time searching for the perfect system (which does not exist) and start trading.
$20.00