Trading Losses, Can You Handle Them
How many trading losses in a row you can handle?
Not sure how many losing trades in a row you can handle? The video below demonstrates how you can quickly build a table in Excel which will show you how losses, in any particular trading system, can develop over time. Knowing this can remove a lot of stress from
a struggling trader.
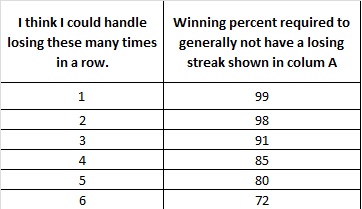
Unable to sleep, having a hard time making a decision, you may be getting near your loss limit. The average trader supposedly starts tweaking their system after as little as three losses in a row. My work with the Monte Carlo simulator suggests that you would need a system which wins more than 94% of the time in order not to have 3 losses in a row. Do you think that is realistic? I don't.
Do this quick test. Take a coin and flip it 100 times or use the random number generator in Excel by typing in this formula =RAND()*100 into cell A1. In cell B1 type =IF(A1>50,"Loss",""). Now drag both of the cells down until you have 100 rows. Count the number of losses you have in a row. To recalculate, just enter any number in an unoccupied cell. You will see that even a system which wins 50% of the time will have 6 losses in a row quite frequently. Can you handle that?
You can easily change the winning percentage by changing out the number in the IF statement. For instance, when your system wins 60% of the time, use =IF(A1>60,"Loss","") or if you want to explore a system which only wins 40% of the time use =IF(A1>40,"Loss","").
Save Time and Understand Your Probabilities

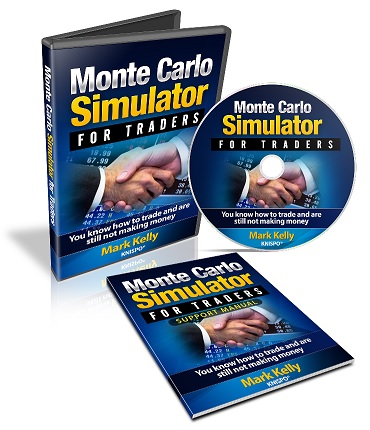
To get a better understanding of the variability a specific system could undergo, I designed the Monte Carlo Simulator for Traders. In this Excel based program, I have a table which details the number of losses in a row you should expect for any type of system.
Once you can visually see the variability in the types of losses one should expect with any given system you can either design a system to obtain what you think you can handle or start to think differently. The program costs $20 and comes with a support manual.
What you focus on expands
When traders start designing a system, many think about their winning percentage. They are unlikely to really comprehend, in most cases, how many losses in a row they should expect. With the Monte Carlo Simulator Tool for Traders you won't be one of the traders who is unaware of how many losses a system can generate.
You never know when this losing string is going to occur. It could occur tomorrow, next month or next year. All you know is that it will occur at some point in the future. When it does occur, will you just say that this is part my system or will you start to break down and want to change your system even though it’s performing as expected?
For instance, over the last couple of months you developed a
system and back tested it. You really
like the final equity. The system
returns an average of 30% per year with a maximum drawdown of 15%. The winning percentage is 50%. You start to
trade it. Do you know how many losses in
a row you should expect out of this system?
Of course you do, as we already discussed this type of system. But what happens if your system returns 45%
or 55% winners?
To make your life easier, there is a table in the Monte Carlo simulation program which, given a specific winning percentage, provides a rough idea of how many times you should expect to see a string of losers. An example of this table is shown below. For instance, from the table even a system which wins 72% of the time will occasionally have 6 losing trades in a row. Does that surprise you? In the risk analysis program, I document down to 30 loses in a row which you can pretty much guarantee if your system only wins 16% of the time. Provided you can handle 30 loses in a row, you can still win big provided your payoff ratio is above around 6.5:1.

Is this reality?
As I started to define my trading system a bit better, I wanted a way to understand the variability of the returns I should expect. More specifically, I wanted to know how many losses in a row I should expect and what the range of final equity would be. For instance, did I want to do 2,000 trades just to make $100,000? As I could not find what I was looking for I designed my own. I have found it quite valuable as I move forward in becoming a master trader.
You have likely heard gurus state that you should find a system that wins at least 50% of the time and delivers a 2:1 reward to risk ratio. This means essentially that for every dollar that you risk, over a large number of trades, you should expect your winning trades to earn at least two dollars. Over 2,000 trades under this scenario you can turn a $10,000 account into an account that has somewhere between 50 and $350 million in it. So what's all the fuss about finding a system that wins 97% of the time?
When I look at that type of return, I start to wonder if it was that simple to find a system that wins 50% of the time with a profit factor of 2:1 then there should be a lot of very wealthy traders. Have you made your millions yet?
So how long would it take to do 2,000 trades? Day traders could likely do this in one to three years. For swing traders it would take roughly 8 years while position traders could take up to 15 years. So what if it took 15 years. Do you make $3,000,000 a year now? I think this sounds like a great journey.
To further explore this idea, I looked on the web for a free Monte Carlo simulator that could be used by traders. I could not find one that suited my requirements. This does not mean that one does not exist, it just means that I could not find it.
I wanted to put in the probability of a win, my account size, the percentage of my account that I was willing to risk and the win loss ratio. With these four numbers I could easily determine, my equity curve, draw down, how many losses in a row I should expect and how much money I should risk per trade.
Frustrated that I could not find what I wanted, I decided to develop my own Monte Carlo Simulation program as I know enough about Excel to do this. I call the end product the Monte Carlo Simulator for Traders.
An example of the input area is shown below. With these four numbers you can get a good idea of what to expect from your trading system.

Monte Carlo Simulator for Traders
I have found that using this Monte Carlo Simulation software has helped me understand what type of losses to expect and also what I should expect in regards to downturn and times when my equity curve will go no where.
The program also gives me an idea on what type of minimum winning percentage as well as the win / loss ratio I need to be satisfied from a psychological point of view.
After I got what I needed out of the program, I thought I might as well offer it to other traders who are looking for a couple of pieces of information which can make them feel more confident as they trade.

The Monte Carlo Simulator for Traders program costs $20. You can get a copy of it by following the link below. The link will take you to PayPal and once you have logged into PayPal you can apply any discount coupon you have. Once you have paid for the program, you will be redirected to a webpage where you can download the program. I also have a couple of bonuses on this page which you may find interesting.
If you have any questions about the program, please use the Contact me page to send me an email.
You can learn more about the Monte Carlo Simulator for Traders by reading other pages on it.
This page gives a more detailed explanation of why using a Monte Carlo simulator program can help you and why you see different types of returns when you input the same numbers
Monte Carlo Simulator for TradersThis page gives a more detailed explanation of the program
This page details the compound interest table and how to use it
This page talks about the profit factor which is a number you need to know about when developing your trading system
Bulls and bears are used to describe the up and down of the market. A bull tends to use its horns to lift oncoming threats out of
the way and raises them into the air which is the direction of a bull market. Bears
tend to come down on you from above hence they represent a bearish market or
one that is falling.
The above desk figurines depict the back and forth of the market as it unpredictably tends to move in a preferred direction. They make good gifts for traders, stock brokers or financial advisors.
Gifts for Stock Traders - Stock traders are a different breed. For the stock trader in your life or as a present to yourself consider getting a trading mug. This can be used throughout the day to sip on your favourite beverage and remind you that you are a trader.
Short Course
Introduction on How to Trade Stocks for Beginning Traders
New to trading, not sure where to start. I have put together a short course consisting of 18 lessons. Each lesson should take less than 5 minutes to review. Each lesson provides you with alternate resources to continue learning about that particular topic.
To learn more about this course and sign up please visit the course webpage by clicking the link below.
Monte Carlo Simulator
for Traders
 Having troubles sticking with your trading system?
Do you move from system to system looking for the one system that will bring you riches?
Perhaps you already have it and tossed it aside when it went into a down period.
Using this Excel based program will show you what you can expect out of your trading system once you know the % wins and profit factor.
Stop wasting your time searching for the perfect system (which does not exist) and start trading.
$20.00


