Monte Carlo Simulator for Traders
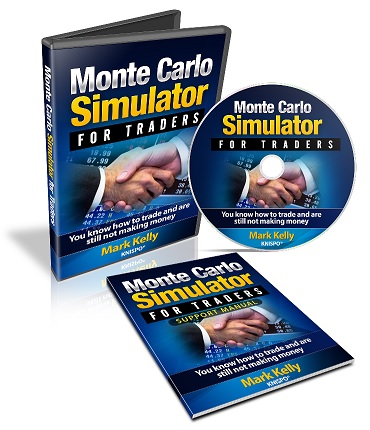
The Monte Carlo Simulator for Traders, is a .xls or .xlsx based program which can be used in Microsoft Excel or other spreadsheets. It allows you to understand the workings of your trading system and gives you an idea of how it will perform in the future. This is important because one of the common themes that losing traders have is to abandon their trading system as soon as losses start to appear.
Getting Started
In order to get started using the Monte Carlo Simulator for Traders program, you will need to know four numbers:
- The probability of a win
- The amount of money which you are willing to risk per trade
- The average win / loss ratio
- Your account size
Two of these numbers are very easy to come up with - the account size and the amount you’re willing to risk. I generally use a $10,000 account in the simulations and generally risk 1% of the account per trade or $100. You should be able to come up with these two numbers relatively quickly.
It’s the other two numbers: probability of a win and the win / loss ratio that take a bit more work. In order to identify these numbers you will need to backtest your trading system either manually or use backtesting software.
Once you have all four numbers you are ready to better understand the future of your trading system.
You will enter your numbers as is shown in the table below.

Once your number are entered, the program will populate the graph in the worksheet. It will look like the graph shown below.
Why Monte Carlo Simulation is Used
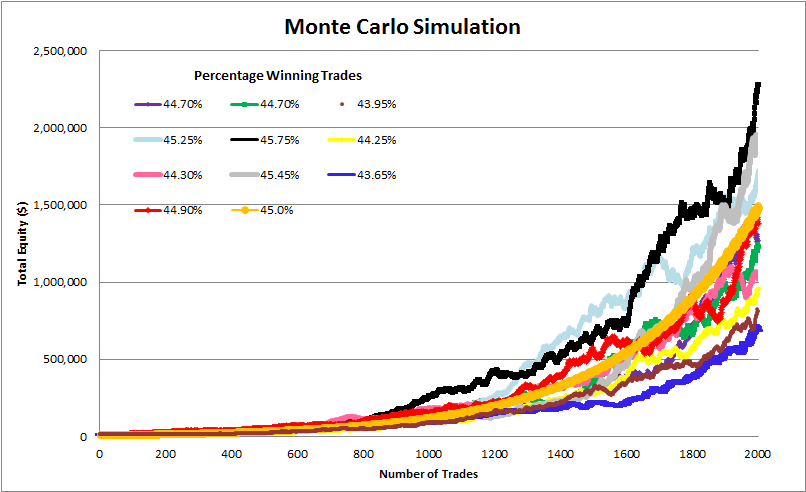
The graph below illustrates why Monte Carlo simulation is used. It shows the variability which one might be met with when trading into the future.

Each curve represents 2,000 trades and is derived from your input data. The winning percentage is placed on the graph and is generally within about 2% of what you entered into the table. The orange line on the graph is the theoretical equity curve and is determined in a slightly different way.
Your Monte Carlo Simulator for Traders comes with a support manual that describes how to use it. There are six worksheets in the Monte Carlo Simulator for Traders:
- Monte Carlo Live
- Win % to rest easy
- Win % vs payoff ratio
- Compound interest
- Gain per trade
- Terms and Conditions of Use
Most of the tables are based on 2,000 trades as it is a reasonably large number and many traders could make these many trades within a reasonable length of time.
The Monte Carlo Simulation program includes a table on what I will call losing strings. That table shows you the results of 2,000 trades done ten times and shows the number of times up to 30 losses in a row could be experienced.
As an example, for systems which win 50% of the time, there is a high probability that over 2,000 trades you are going to experience 10 losing trades in a row. Now 10 losing trades will not be normal but should occur every once in a while over 2,000 trades. On the other hand losing seven times in a row is pretty much guaranteed.
As a matter-of-fact over 2,000 trade you should expect a series of seven losing trades at least eight times. So before you start trading a system which wins 50% of the time, if you don’t think you can handle seven losing trades in a row, you better find a system that has a better probability of a win than 50%.
The Monte Carlo Simulator for Traders

What determines the win/loss ratio is the trading systems winning percentage. You can make a lot of money winning between 40 to 60% of the time provided your wins are large compared to your losses.
Using the Monte Carlo Simulator for Traders, you can easily identify equivalent trading systems. There is a graph on the Win % vs payoff ratio worksheet that shows equivalency when it comes to trading systems. For instance, a system which wins 50 % of the time with a profit factor of 1.5 is equivalent to a system which wins 40% of the time with a profit factor of 2.25.
After I built the Monte Carlo Simulator for Traders Excel program I began to understand how different systems could return the same ending capital. The only thing I needed to do was to figure out what type of system I needed to satisfy my psychology. This then allowed me to stick with my systems instead of always building new ones.
You may find that understanding your trading system better will improve your trading. If so, you can get a copy of the Monte Carlo Simulator for Traders Excel program with accompaning PDF support manual for $20. The link below will take you to Paypal which will then redirect you back to this site where you can download the Excel program and PDF manual.
Accepting Losses
Sit down and ask yourself how many losses in a row do I think I can handle? Review the table on the 2nd worksheet titled "Win % to rest easy". This will give you an idea of the winning percentage you need to satisfy your need to be right.
You can also go to "Monte Carlo Live" and type in a percentage for winning trades. This will immediately recalculate all of the equations on that work sheet and provide you with the number of times you can be expected to lose a specific number of times in a row over 2,000 trades. So for a system that wins 50% of the time, you can almost be guaranteed to lose 10 times in a row provided you trade long enough.
So if it takes you 10
years to do 2,000 trades then you should expect that over that period of
time, you most likely experience a losing streak which contains 10 losses in a row. If
you can accept that then you can play around with the winning percentage
in your Monte Carlo Simulation program and find a range which will
work for you.
Bulls and bears are used to describe the up and down of the market. A bull tends to use its horns to lift oncoming threats out of
the way and raises them into the air which is the direction of a bull market. Bears
tend to come down on you from above hence they represent a bearish market or
one that is falling.
The above desk figurines depict the back and forth of the market as it unpredictably tends to move in a preferred direction. They make good gifts for traders, stock brokers or financial advisors.
Playing with the numbers
The frustration of a loosing streak can be somewhat reduced when you understand your system and this is what the Monte Carlo Simulator for Traders was designed to do. Think of it as a risk management tool which you can use to quickly determine your comfort zone in regards to winning probability.
There are all sorts of combinations that make sense just as there’s a whole bunch of combinations which don’t. You might be extremely thick-skinned and be totally willing to accept 20 losses in a row. If you can accept winning 30% of the time you will need to ensure that the amount won is significant enough (above 3.5 x your loss amount) to be highly profitable. These types of systems are much different than ones that require you to win 60% of the time and where you only need a payoff ratio of 1.25 to be highly profitable.
Both of these systems have approximately the same equity curve over 2,000 trades and the traders who use these two systems will have a totally different mind set. With this simulation software in hand, you can very quickly run a number of situations and determine which one would likely be best for you.
The Monte Carlo Simulator for Traders Program

The Monte Carlo Simulator for Traders program costs $20. You can get a copy of it by following the link below. The link will take you to PayPal and once you have logged into PayPal you can apply any discount coupon you have. Once you have paid for the program, you will be redirected to a webpage where you can download the Monte Carlo Simulator for Traders program. I also have a couple of bonuses on this page which you may find interesting.
If you have any questions about the program, please use the Contact me page to send me an email.
You can learn more about the Monte Carlo Simulator for Traders by reading other pages on it.
This page talks about losses and why you need to understand them
This page gives a more detailed explanation of why using a Monte Carlo simulator program can help you and why you see different types of returns when you input the same numbers
This page details the compound interest table and how to use it
This page talks about the profit factor which is a number you need to know about when developing your trading system
Gifts for Stock Traders - Stock traders are a different breed. For the stock trader in your life or as a present to yourself consider getting a trading mug. This can be used throughout the day to sip on your favourite beverage and remind you that you are a trader.
Short Course
Introduction on How to Trade Stocks for Beginning Traders
New to trading, not sure where to start. I have put together a short course consisting of 18 lessons. Each lesson should take less than 5 minutes to review. Each lesson provides you with alternate resources to continue learning about that particular topic.
To learn more about this course and sign up please visit the course webpage by clicking the link below.
Monte Carlo Simulator
for Traders
 Having troubles sticking with your trading system?
Do you move from system to system looking for the one system that will bring you riches?
Perhaps you already have it and tossed it aside when it went into a down period.
Using this Excel based program will show you what you can expect out of your trading system once you know the % wins and profit factor.
Stop wasting your time searching for the perfect system (which does not exist) and start trading.
$20.00


