Technical Analysis of Stocks
Technical Analysis - The art of predicting the future direction of a stock
In the stock market, from my point of view, technical analysis involves using the information provided in stock charts to determine which stocks to buy, when to buy, how much to buy and when to sell. A stock chart is a pictorial view of all of the action taken by all of the traders who are involved in the stock and have taken a position in it. Within these traders will be pure speculators who know nothing about the stock and traders who are very knowledgeable in the stock and may have information others will find difficult to get. The pattern that the chart provides should give you a reasonable idea on how the world currently views this a particular stock.
People who use a companies fundamentals to make their buying and selling decisions tend to be investors not stock market traders. In this case, I am considering an investor to be a long term trader.
Before you begin your journey into technical analysis, you will need to determine:
Bulls and bears are used to describe the up and down of the market. A bull tends to use its horns to lift oncoming threats out of
the way and raises them into the air which is the direction of a bull market. Bears
tend to come down on you from above hence they represent a bearish market or
one that is falling.
The above desk figurines depict the back and forth of the market as it unpredictably tends to move in a preferred direction. They make good gifts for traders, stock brokers or financial advisors.
1. What type of trader are you?
Based on the definitions I will use, there are four different types of traders:
- Scalper - holds stocks for seconds to minutes
- Day trader - holds stocks for minutes to hours
- Swing trader - holds stocks for hours to days
- Position trader - holds stocks for weeks to months
Note: While an Investor also buys and sells stocks, they hold stocks for years to decades. Remember, stock investing and stock trading are not the same.
Also, Scalping is typically done by computer programs which buy and sell very small increments in price in large volumes. Looking for 1 to 2 cents on each trade over millions of shares adds up over time. Some traders, who use very short term charts, may be considered scalpers as well. Trading is fractal and as such, similar patters will be available in most time frames. Excellent money management and execution is required when scalping. It is an area I have not participated in.
2. What time frame are you going to trade?
The time frame you are going to trade determines the type of stock charts you will likely use. The following is a general idea of what type of stock market charts different traders use:
- Interday charts - used by scalpers, day-traders and swing traders
- Daily charts - used by swing traders and position traders
- Weekly charts - used by position traders and investors
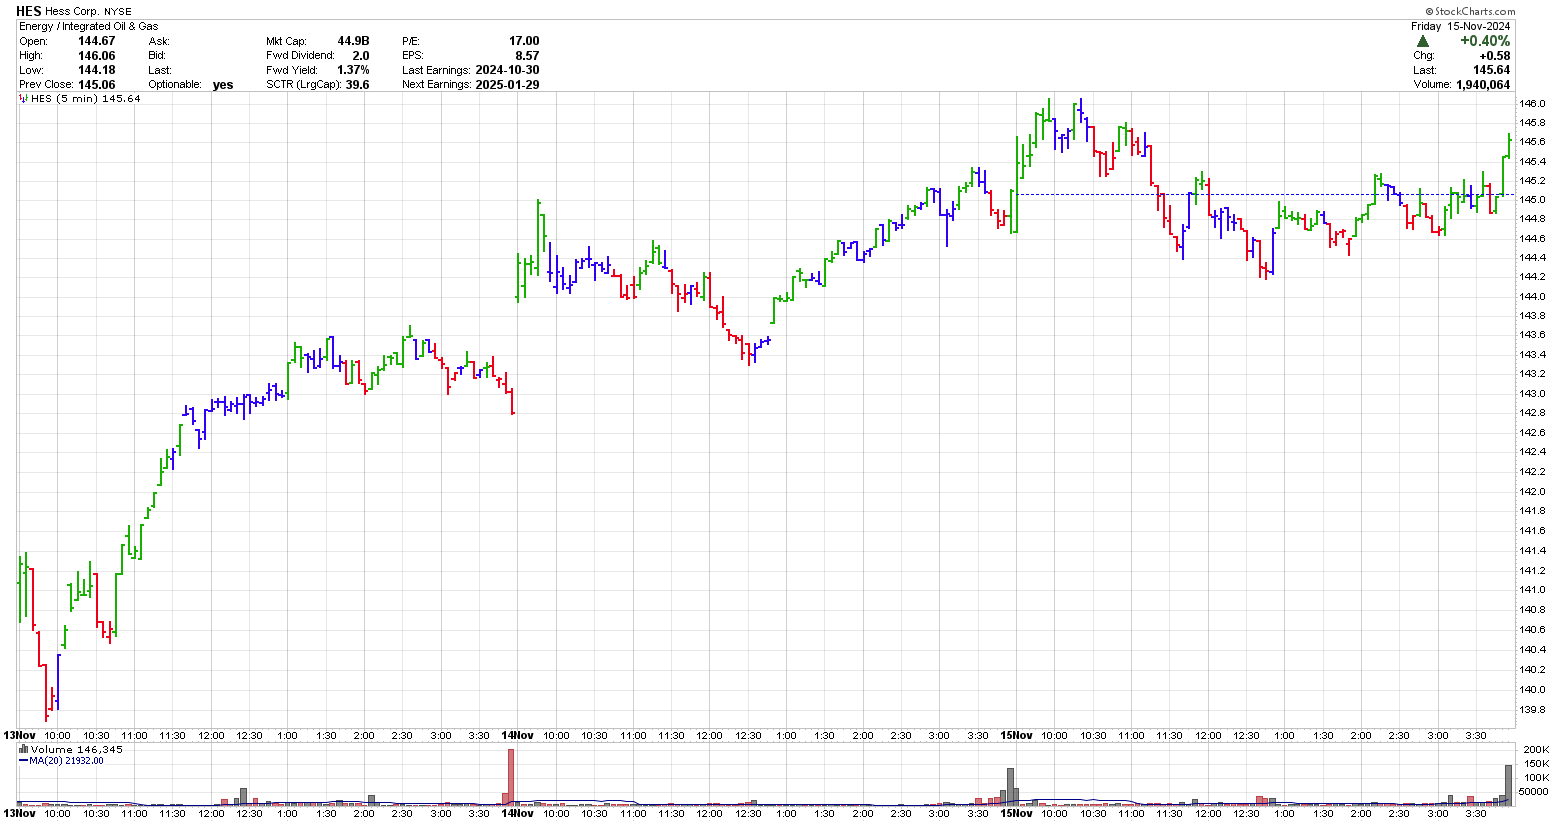
While some traders trade off of 10 second and 1 minute charts, you will get an understanding of intraday trading by looking at the 5-minute chart of HES shown below. This chart covers 3 days between November 13 to 15, 2024. You can see the relatively large gap between the end of trading Nov 13 and the start of trading on Nov 14. This is one reason that day traders don't hold overnight. Holding overnight brings us to swing traders.

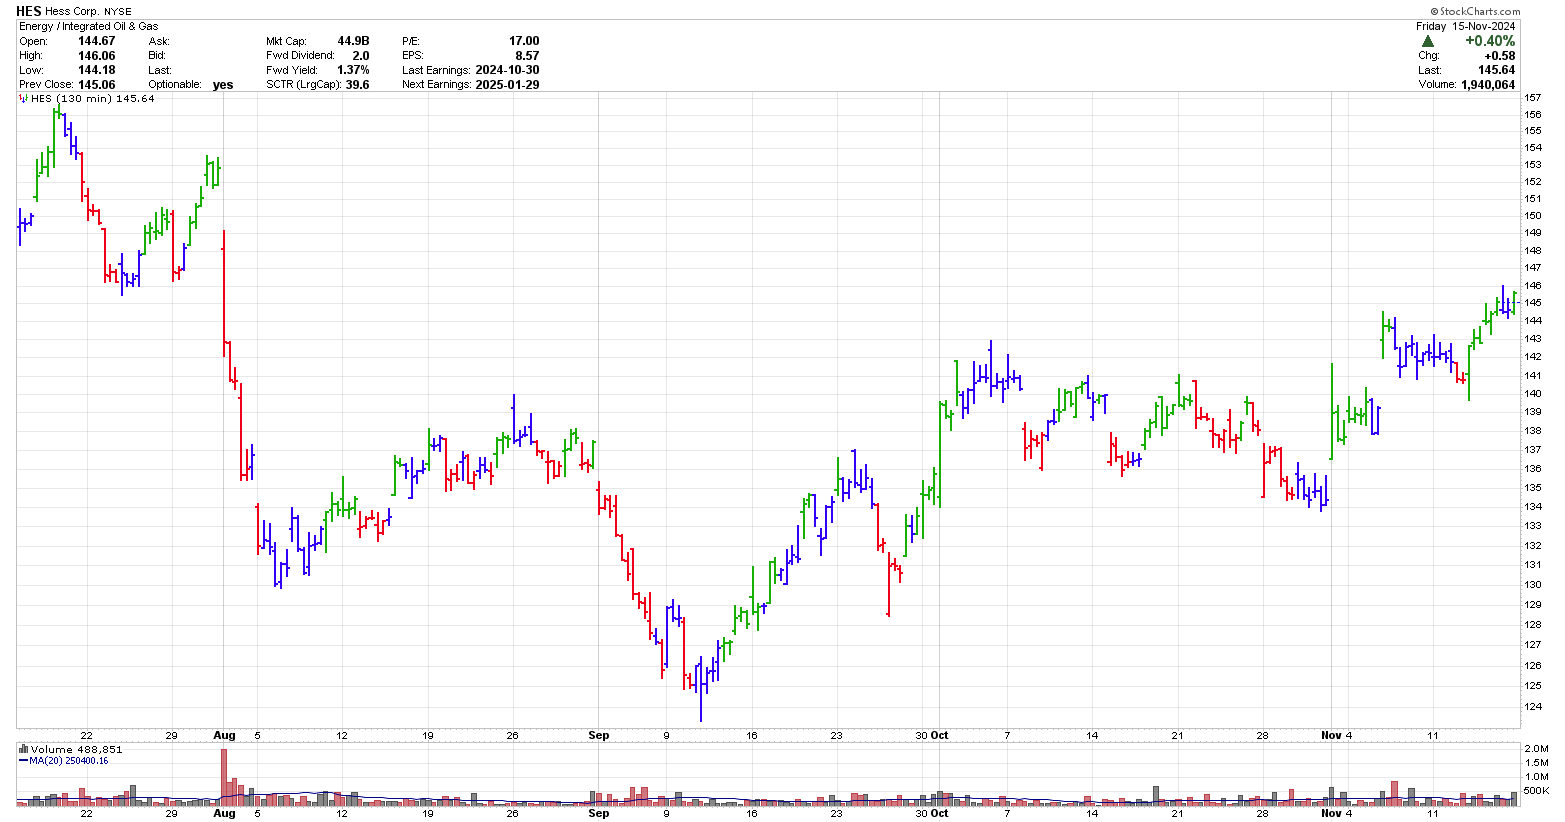
While swing traders typically use any type of intra-day charts, I find 15-minute to 130-minute charts work well. Below is a 130-minute chart of HES from mid-July 2024 to min-November 2024. With a higher time frame, smaller positions are typically taken and a bit more space is put between the entry and exit. You can see a number of short term trades in HES over this 4-month period.

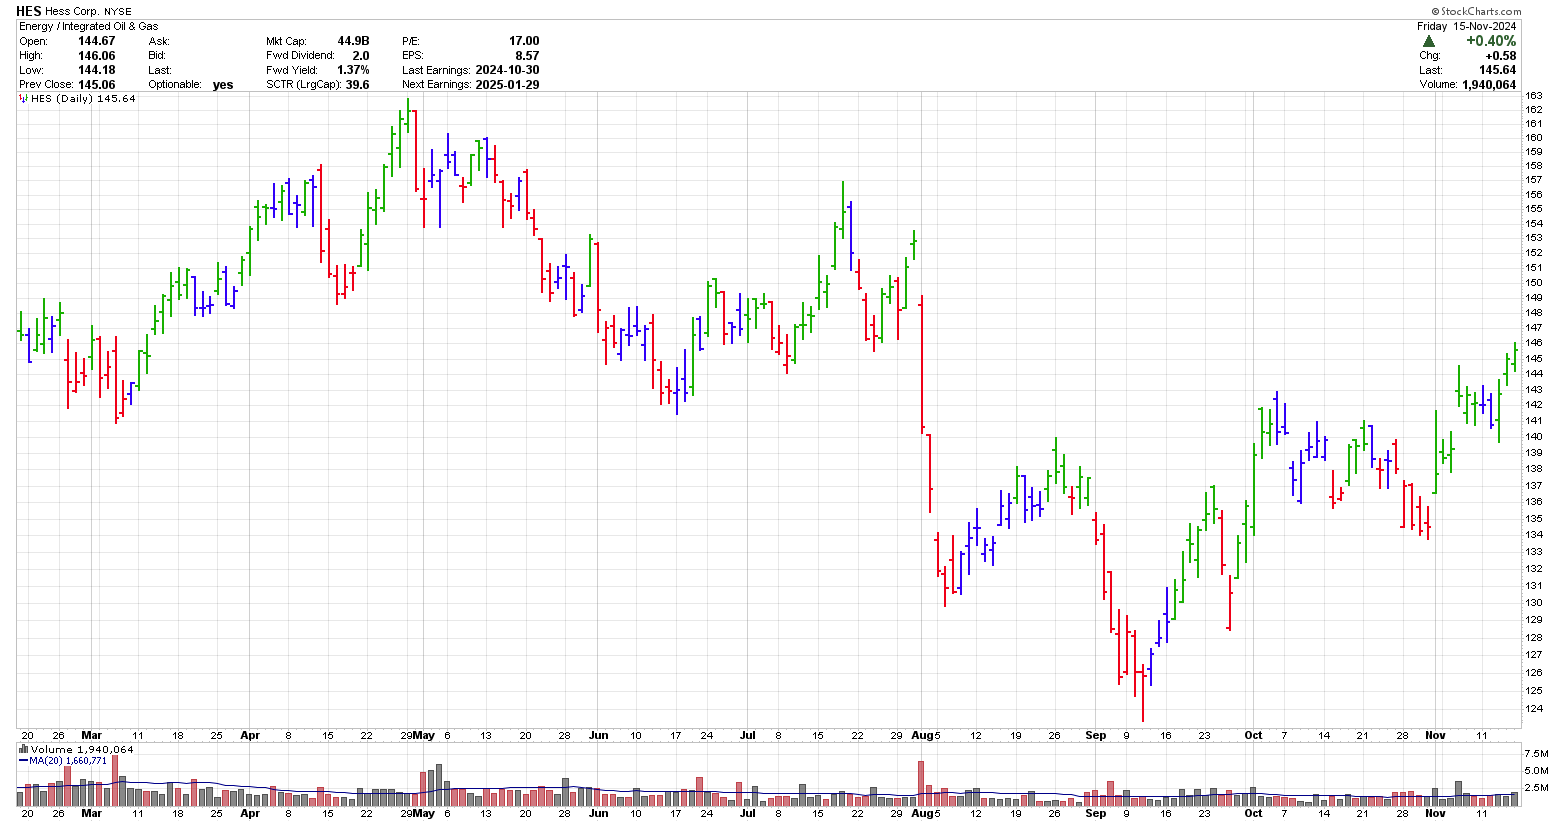
In the daily chart below of HES, you can identify a few longer term trades which could be classified as swing or perhaps position trades.

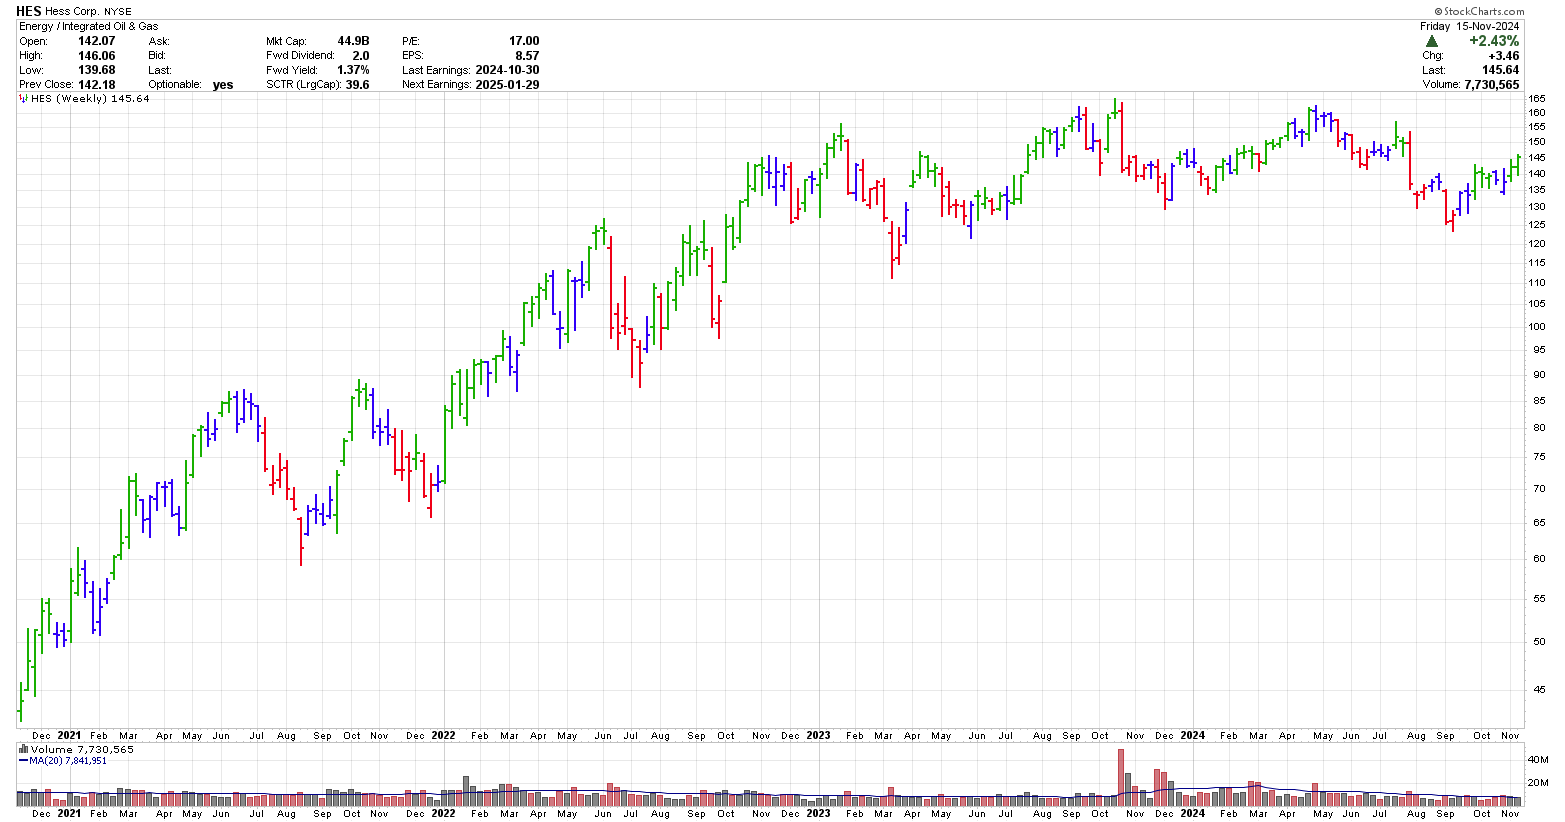
Below is a weekly chart of HES and you can see that a position trader could have entered early in 2021 and depending on where they had their stop they could have gotten out in August 2021 or could still be holding the stock with a stop loss under $110 or $120.

Stock Chart courtesy of StockCharts.com
While the above charts only show coloured bars, which align to Elder's Impulse System, many traders choose to put indicators on their stock charts to help them identify their entry and exit point. There are hundreds of indicators available. When choosing your indicators ensure you do not use more than 4 or 5 as more than this will typically cause analysis paralysis.
In technical analysis, the trader uses stock charts to:
1. Identify which stock to buy
2. Identify how many shares to buy
3. Identify stock market timing
4. Identify when to sell
3. Finding trades
To find trades, stock traders generally use either a paid or free stock market screener. These stock screeners identify stocks that are doing what the trader wants. For example, some traders look for new 52-week highs, moving average crossovers or signals from various indicators.
This site deals mainly with trading stocks using swing trading and position trading techniques.
To broaden your skills as a stock trader, you should consider reading many of the great books that have been written on the subject. I have a number of book reviews on technical analysis in the book summaries section of this website, which you many be interested in.
Gifts for Stock Traders - Stock traders are a different breed. For the stock trader in your life or as a present to yourself consider getting a trading mug. This can be used throughout the day to sip on your favourite beverage and remind you that you are a trader.
Short Course
Introduction on How to Trade Stocks for Beginning Traders
New to trading, not sure where to start. I have put together a short course consisting of 18 lessons. Each lesson should take less than 5 minutes to review. Each lesson provides you with alternate resources to continue learning about that particular topic.
To learn more about this course and sign up please visit the course webpage by clicking the link below.
Monte Carlo Simulator
for Traders
 Having troubles sticking with your trading system?
Do you move from system to system looking for the one system that will bring you riches?
Perhaps you already have it and tossed it aside when it went into a down period.
Using this Excel based program will show you what you can expect out of your trading system once you know the % wins and profit factor.
Stop wasting your time searching for the perfect system (which does not exist) and start trading.
$20.00


